Restaurant Finance · 2026-09-21 · 7 min
Restaurant Food Waste Cost Percentage: Formula, Targets and a Weekly Tracking Routine
Food waste cost percentage is the dollar value of food thrown away or given away by mistake, divided by either net sales or food purchases for the same period. A restaurant with $28,000 in weekly sales that logs $620 of waste is running waste at 2.2% of sales and about 6.7% of the $9,200 it spent on food that week. The two percentages answer different questions, and tracking both is what turns waste from a complaint into a controllable number.
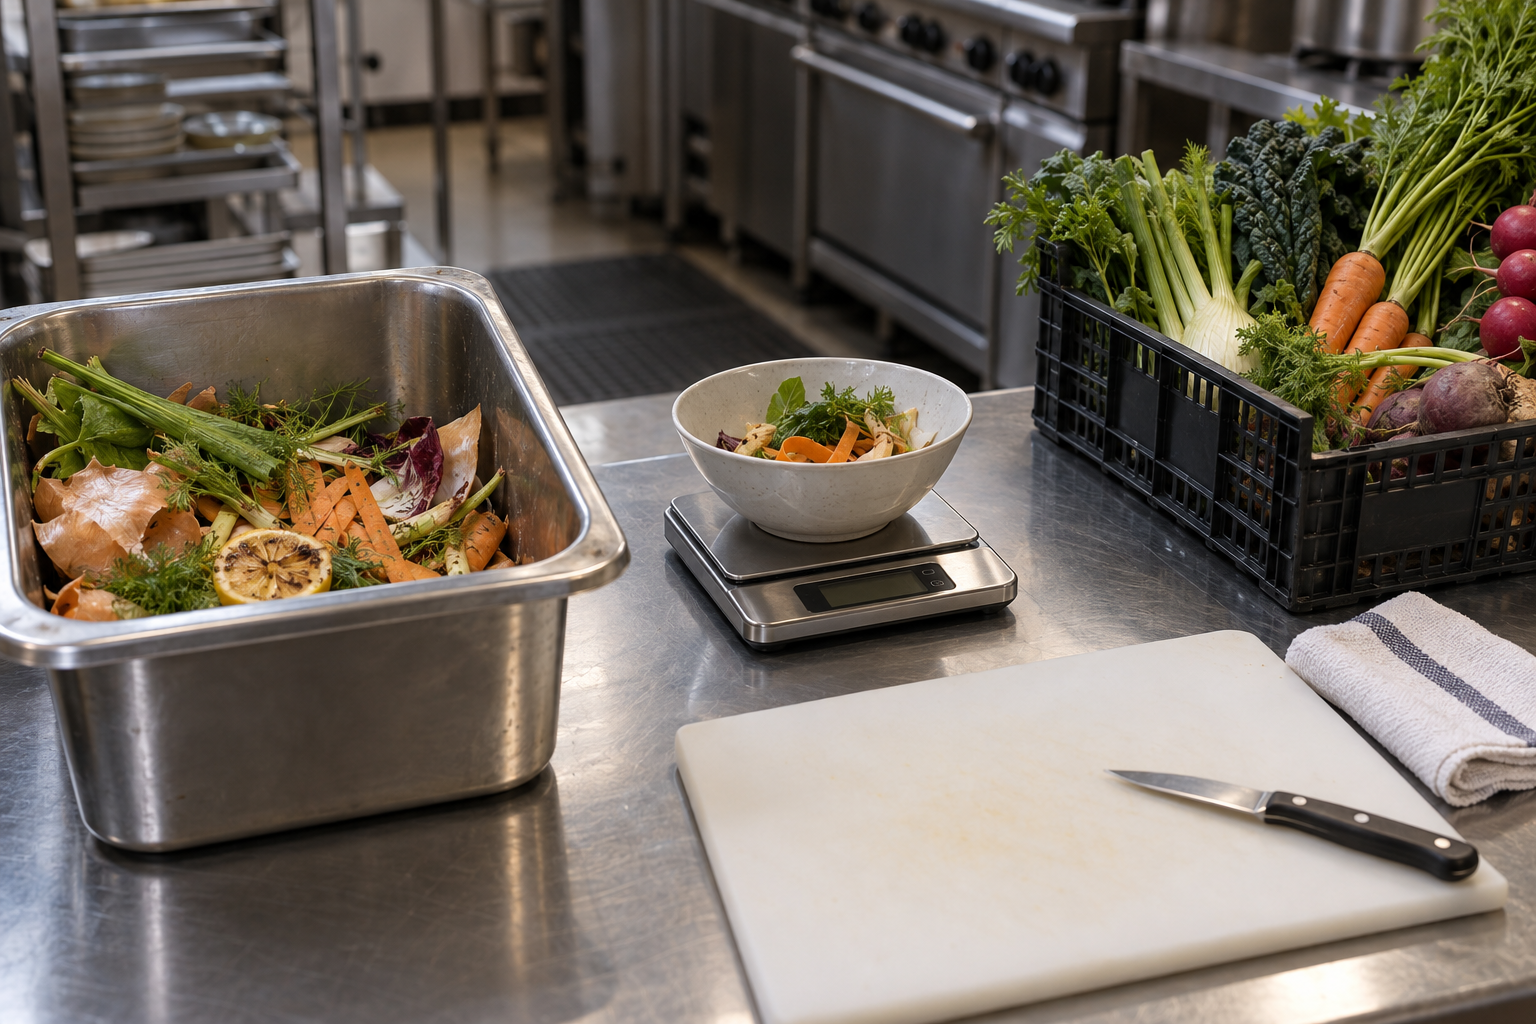
What actually counts as food waste
Waste is any food you paid for that never generated revenue. In practice it shows up in five places, and each has a different owner:
Unavoidable trim is not really waste: bones, peels, coffee grounds and fat are part of the yield you already pay for, and they are captured in your yield tests and plate costs. Keep it out of the waste log or your number will look worse than it is and nobody will trust it.
- Spoilage: product that expires in the walk-in or on the shelf before it is used.
- Over-prep: batches, sauces or prep trays made ahead of demand and discarded at close.
- Avoidable trim: usable product lost to rushed or untrained fabrication, not the unavoidable bone, fat and peel.
- Remakes and drops: plates sent back, dropped at the pass, or remade because the order was wrong.
- Staff error: miss-fired tickets, wrong portions, unlabeled product that cannot be identified later.
The two formulas
Waste as a percentage of sales:
waste % of sales = waste dollars ÷ net sales × 100
Waste as a percentage of food purchases:
waste % of purchases = waste dollars ÷ food purchases × 100
The sales figure is the one that connects to your P&L, because waste is one of the reasons your actual food cost runs above your theoretical food cost. The purchases figure is the one your kitchen can act on this week, because it says how much of what came through the back door never reached a guest.
If you want the full bridge from theoretical cost to actual cost, our guide to the food cost formula walks through it line by line.
Worked example: a $620 week
The numbers below are illustrative, not a benchmark.
| Waste source | Dollars | Share of waste |
|---|---|---|
| Spoilage (proteins, dairy, produce) | $214 | 34.5% |
| Over-prep (sauces, rice, prep trays) | $178 | 28.7% |
| Avoidable trim (fish, primal cuts) | $96 | 15.5% |
| Remakes and drops | $88 | 14.2% |
| Staff error and miss-fires | $44 | 7.1% |
| Total | $620 | 100% |
With net sales of $28,000, waste is 2.2% of sales. With food purchases of $9,200, it is 6.7% of purchases. If the operation's theoretical food cost was 30.0% ($8,400) and actual food cost was 31.9% ($8,932), the $620 waste log explains most of the $532 gap — and the difference that remains is where you look next.
Where the waste dollars usually hide
Before setting targets, check the five highest-frequency causes. In most restaurants they are unglamorous and fixable:
Each of these has a different fix: rotation discipline, a forecast-based prep list, portion tools, batch sizing, and a labeling rule. Treating "waste" as one problem is why the number never moves.
- High-value proteins left in original packaging instead of being dated and rotated.
- Prep lists written from habit rather than from a sales forecast.
- Portioning by eye on the line when the house standard is a scale or a scoop.
- Sauce and base batches sized for the busiest day of the week, every day.
- Nothing labeled, so opened product gets pushed to the back and reordered.
Run the log daily, review it weekly
The routine only works if the daily part takes seconds:
1. Daily, two minutes at close: the closing lead records every discard with a dollar estimate and a cause category. A whiteboard photo is fine; a shared note is better. 2. Weekly, fifteen minutes: add the week's entries, divide by sales and purchases, and compare with the previous three weeks. 3. Pick one cause per week: assign one owner and one change. For example: "over-prep — cut rice and sauce batch size by a third for two weeks." 4. Check the effect next week: if the cause does not move, the fix was wrong or the cause was misclassified. 5. Re-price the menu if needed: if a trimmed protein's usable cost rose, take the corrected number into the plate cost calculator before deciding on a menu change.
A four-week trend is the minimum useful view. One bad week is usually a delivery problem or a holiday, not a system failure.
Setting a target that is honest
You cannot skip straight to a number someone else published. Start with your own baseline over four weeks, then aim for a step change you can defend:
Whatever band you choose, express it in dollars so the kitchen can see it: "2% of a $28,000 week is $560; we are at $620; the gap is $60."
- If waste is above 4% of sales: find the single biggest category first and cut it in half.
- If waste is between 2% and 4% of sales: tighten prep and rotation, and expect a slow climb rather than a jump.
- If waste is below 2% of sales: protect the routine and audit for under-reporting, which is common when staff think the log is a punishment.
Limitations and assumptions
- The log only captures what someone writes down. Spoilage discovered by a manager, staff meals and unrecorded tastes are usually missing, so treat the number as a floor, not a precise measurement.
- Waste as a percentage of sales moves when sales move even if waste dollars stay flat. Compare weeks with similar volume, or use both formulas.
- Cause categories overlap. A protein can be spoiled because it was over-ordered and unrotated; pick the cause closest to the decision you can actually change.
- Dollar estimates from a whiteboard are approximate. If waste cost matters to a bonus or a price decision, weigh the top two or three items rather than estimating everything.
- This routine measures waste; it does not replace yield tests, inventory counts or a theoretical-versus-actual food cost review, which catch different errors.
FAQ
Is food waste percentage the same as food cost variance?
No. Food cost variance compares theoretical cost with actual cost across the whole menu, which includes portioning errors, theft, miscounts and waste. Waste percentage is one line inside that gap, measured directly from what was discarded. A rising variance with flat waste usually points at portioning, receiving or counting instead.
How often should I count waste?
Log daily and review weekly. Daily logging happens at close and takes two minutes. The weekly review is where you total the dollars, compare with the last three weeks, and assign one fix. Monthly inventory counts then confirm that the log and the shelf agree.
What if staff under-report waste?
Make the log about the process, not the person: no names on entries, no discipline tied to individual dollars, and a manager who logs their own mistakes first. Then spot-check by weighing one category — usually proteins — for a week. Under-reporting shrinks fast when people see the number used to fix purchasing instead of to assign blame.
Should waste include staff meals?
Separate it. Staff meals are a deliberate benefit with a real cost, and mixing them into waste hides the operational number you are trying to manage. Track staff meals as their own line in the same weekly summary so the total food leaving the kitchen is still visible.
Next step
Run your menu numbers before changing prices. Use the free calculator, then turn the best opportunities into a weekly margin routine.
Open the calculator