Restaurant Finance · 2026-07-06 · 13 min
Food Cost Variance in Restaurants: Find the Leak Before It Hits Cash Flow
Food cost variance is the difference between what the ingredients sold during a period should have cost and the inventory value actually used during that same period. To find the leak, calculate theoretical and actual usage on matching dates, express the gap in dollars and percentage points of food sales, then split it by category. Validate counts, invoices, units, transfers and recipes before investigating operations. Start with the largest reliable category gap, trace it to evidence such as invoices, yield checks, portion tests, waste logs or comp records, and assign one corrective test. Variance is a warning signal, not proof of waste, theft or lost cash.
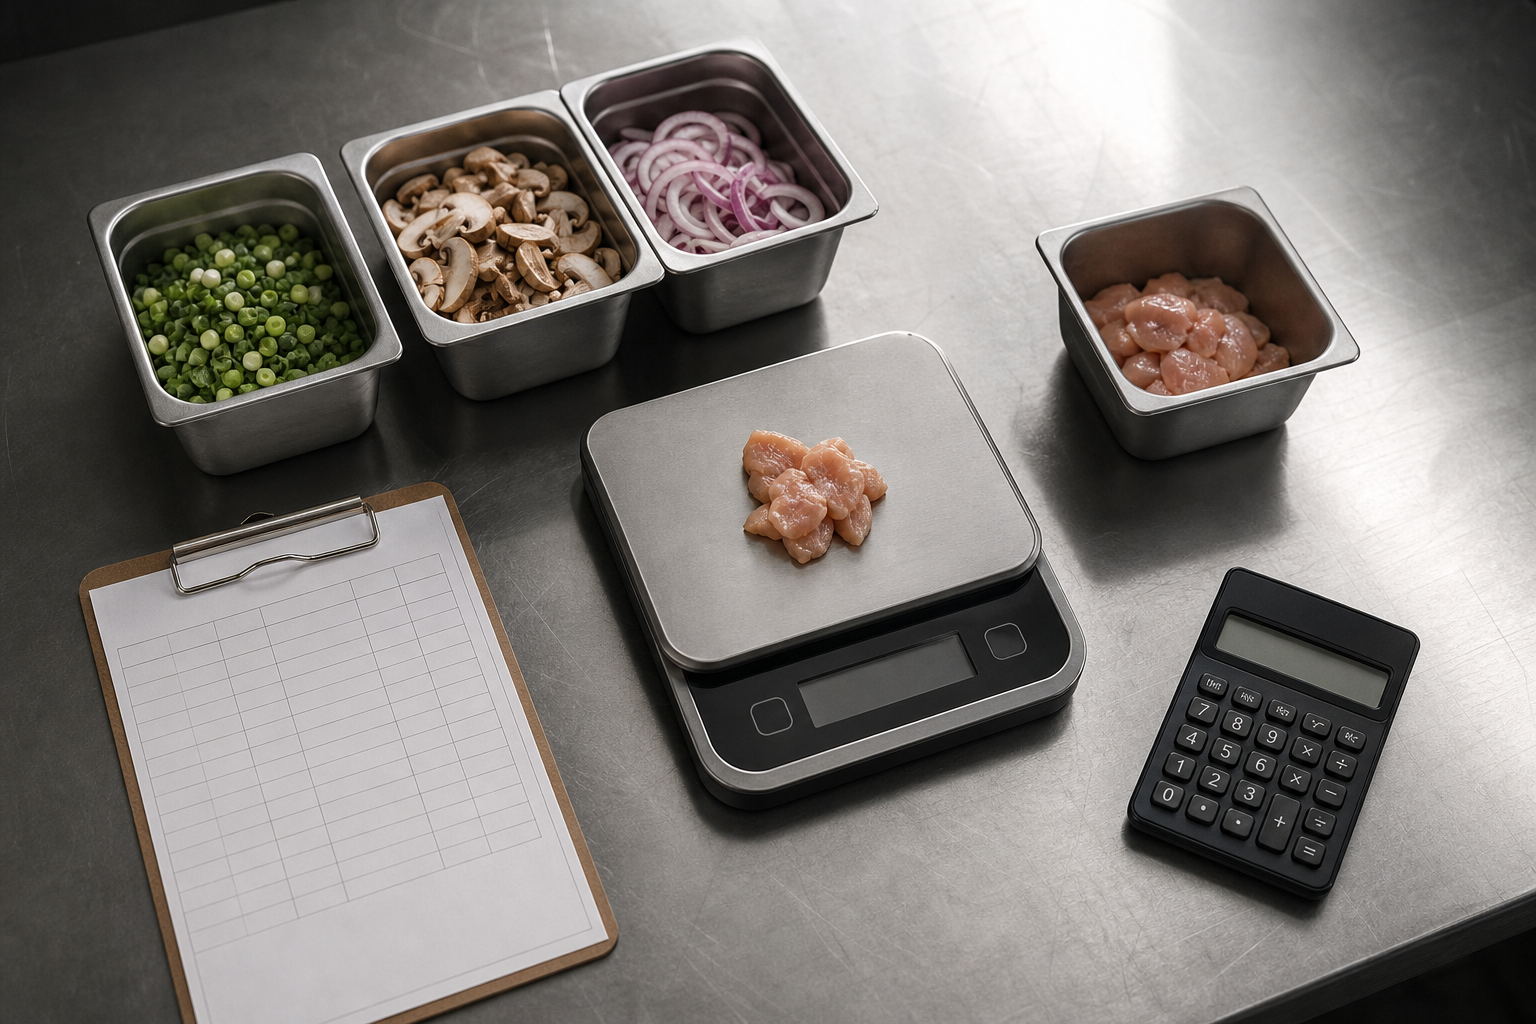
The three numbers—and the distinction that prevents bad decisions
Theoretical food cost is the ingredient cost implied by the items sold, their recipe quantities, usable yields and the costs assigned to those ingredients. It answers: *what usage cost should these recorded sales have produced?*
Actual food usage cost is:
Beginning food inventory + food purchases − ending food inventory
All three values must cover the same locations, categories, units and cutoff period. Include recorded transfers in or out consistently with the way the operation defines inventory usage.
Food cost variance in dollars is:
Actual food usage cost − theoretical food cost
To make periods with different sales comparable, also calculate:
Variance percentage points = variance dollars ÷ food sales × 100
Call the result “percentage points of sales”, not “per cent over theoretical”. A second ratio—variance divided by theoretical cost—answers a different question and should be labelled explicitly if used.
Most importantly, usage cost is not the same as cash outflow. Purchases enter the usage formula, but payment timing, supplier terms, old stock consumed and new stock still on hand can separate inventory usage from bank movement. A positive variance may pressure margin; it does not by itself identify when cash moved or prove the effect on net profit.
The V-B-P-A variance triage framework
Use four gates in order: Validate, Bridge, Prove, Act (V-B-P-A). This prevents a plausible story from becoming a premature fix.
1. Validate the comparison.
Do not diagnose an operational leak until the inputs describe the same thing.
If a check fails, correct or annotate the data first. A data-quality correction is a valid outcome; it is not evidence that the kitchen performed badly.
2. Bridge the total to categories.
Break the total variance into categories that follow how the restaurant buys, stores and controls food—for example, protein, produce, dairy and dry goods. Keep the category definitions stable between periods.
For each category, record theoretical cost, actual usage cost, variance dollars and percentage points of food sales. The category variances should sum to the total. If they do not, create an “unallocated” line rather than hiding the reconciliation gap.
Rank categories by reliable variance dollars, not by the most dramatic percentage. A large number based on an uncertain count belongs in validation; a smaller but well-supported number may be ready for investigation.
3. Prove a cause with evidence.
Treat every cause as a hypothesis until a record or observation supports it. Follow the evidence path that matches the suspected mechanism:
The objective is not to make every dollar fit a convenient narrative. It is to reduce the unexplained amount while preserving uncertainty honestly.
4. Act through one controlled check.
Assign one owner, one action, one measure and one review date. Examples include correcting a pack conversion, updating a recipe cost, introducing a portion tool at one station, changing a prep quantity, or recording transfers at dispatch and receipt. Compare like periods and preserve service, food safety and product-quality requirements. If several things change at once, the next review may show movement without revealing which action mattered.
- Period: Sales, purchases, opening inventory and closing inventory use identical cutoffs.
- Count: The same storage areas are counted, with late deliveries and open containers handled consistently.
- Units: Invoice packs, inventory units and recipe units convert correctly; kilograms are not treated as cases or purchase weight as usable weight.
- Scope: Food is separated from packaging, cleaning products, beverages and other non-food purchases according to the operation’s reporting design.
- Movement: Transfers, returns, credits, staff meals, comps and event usage are recorded in the intended period.
- Recipe basis: Recipes, portions, ingredient substitutions, yield assumptions and assigned ingredient costs reflect the period being reviewed.
- Purchase price or substitution: compare invoice line, pack size, credit and recipe cost assignment.
- Yield: compare purchase weight with measured usable yield under the current preparation method.
- Portioning: weigh or count a defined sample during normal production and compare it with the current recipe.
- Waste or spoilage: reconcile dated waste records to item, quantity, unit cost, reason and disposition.
- Comps, meals or refires: compare point-of-sale or manager records with the ingredient usage expected for those items.
- Transfer: match sending and receiving records by item, quantity, unit and date.
- Count or conversion error: recount the relevant stock and inspect the conversion factor.
- Unexplained movement: preserve it as unexplained; do not relabel it as theft without separate evidence.
Food cost variance bridge worksheet
Copy this structure into the operating record used for each review:
| Field | What to enter | Control question |
|---|---|---|
| Period and cutoff | Opening and closing date/time | Do inventory, purchases and sales match exactly? |
| Category | Stable purchasing/control group | Is every food item assigned once? |
| Food sales | Sales for the same period | Are voids and comps treated consistently? |
| Theoretical cost | Sold quantity × current recipe usage cost | Are recipes, yields and substitutions current? |
| Actual usage cost | Opening inventory + purchases − closing inventory, adjusted consistently for transfers | Were all locations and movements included? |
| Variance dollars | Actual − theoretical | Do category rows reconcile to the total? |
| Variance points | Variance ÷ food sales × 100 | Is the denominator labelled and unchanged? |
| Data-quality status | Pass, corrected or unresolved | Could the gap be measurement error? |
| Cause hypothesis | Price, yield, portion, waste, comp, transfer, count or other | What evidence would disprove it? |
| Evidence inspected | Specific invoice, count, log or observation | Does it cover this period and item? |
| Explained amount | Supported dollar allocation | Does the bridge exceed the category variance? |
| Owner and action | Named role and single intervention | Is the action within that role’s control? |
| Review date | Next comparable review | What result would support, reject or extend the test? |
Do not force “explained amount” to equal variance. An explicit unresolved balance is more useful than false precision.
Worked example: a hypothetical weekly category bridge
This example uses invented round numbers only to demonstrate the method; it is not a benchmark or a reported restaurant result.
A restaurant records food sales of $24,000 for one week. Its opening food inventory is $4,000, food purchases are $6,200, and closing food inventory is $4,260.
Actual food usage cost is:
$4,000 + $6,200 − $4,260 = $5,940
Current recipes applied to the week’s recorded sales produce theoretical food cost of $5,520. Therefore:
The category bridge is:
| Category | Theoretical | Actual usage | Variance | Points of food sales | Data status |
|---|---|---|---|---|---|
| Protein | $3,600 | $3,940 | $340 | 1.42 | Passed after recount |
| Produce | $1,200 | $1,260 | $60 | 0.25 | Passed |
| Dairy | $720 | $740 | $20 | 0.08 | Passed |
| Total | $5,520 | $5,940 | $420 | 1.75 | Reconciled |
Protein is investigated first because it carries $340 of the reconciled gap. The manager does not immediately impose a portion change. Invoice comparison supports $120 from a price change not yet reflected in recipe costs. Matched dispatch and receipt records support $80 from a transfer omitted from the original usage record. A defined portion check, valued with the verified unit cost and actual item count, supports $105 of excess usage. The remaining $35 stays unexplained.
That bridge leads to three different actions: update the ingredient cost used in recipes, correct the transfer workflow, and run a limited portion-control check. It would be misleading to call the entire $340 “waste” or claim that correcting it will put $340 into the bank. One component updates the baseline, one fixes recording, one indicates operational usage, and one remains uncertain.
- Theoretical food cost percentage: $5,520 ÷ $24,000 = 23.00%
- Actual usage percentage: $5,940 ÷ $24,000 = 24.75%
- Variance: $5,940 − $5,520 = $420
- Variance percentage points: $420 ÷ $24,000 × 100 = 1.75 points
Decision table: what to do with the first reliable signal
| Signal after validation | Inspect next | Appropriate first action | Do not conclude |
|---|---|---|---|
| Invoice cost changed; physical usage aligns | Invoice, pack, credit, substitution and recipe cost | Update unit and recipe cost; review affected dishes | The kitchen wasted food |
| Actual units exceed expected units | Portion observation, yield test, waste and refire records | Test one control at the relevant item or station | Theft caused the gap |
| One count moves sharply, then reverses | Count sheet, storage map, unit conversion and cutoff | Recount and correct the count process | A one-period “saving” is permanent |
| Transfers differ between sender and receiver | Both transfer records and dates | Use one unit and matched acknowledgement | The receiving location consumed the difference |
| Waste record rises with production | Prep quantity, demand pattern, safe carryover and reason codes | Adjust one prep decision and monitor equivalent days | All recorded waste is avoidable |
| Theoretical cost changes after recipe review | Recipe version, yield, substitution and item mapping | Establish a dated recipe baseline | Operations deteriorated |
| Gap remains after checks | Scope, missing movements and evidence coverage | Keep an unresolved balance and widen the next check | Unexplained means stolen |
| Percentage worsens while dollars fall | Food sales and mix alongside dollar variance | Review both dollars and points before acting | The larger percentage is the larger cash effect |
Implementation steps for a repeatable review
1. Choose the period and owner. Use a cadence short enough to preserve operational memory but long enough to count consistently. Volatile categories may need closer review; low-volume operations may need a longer comparable period. 2. Freeze the cutoffs. Document count time, included locations, invoice cutoff and sales cutoff before collecting numbers. 3. Calculate actual usage. Reconcile inventory, purchases, returns, credits and transfers under one documented convention. 4. Calculate theoretical cost. Apply dated recipes, portions, yields and ingredient costs to the items recorded as sold or otherwise intentionally issued. 5. Reconcile categories. Confirm that all category rows sum to the total and display any unallocated balance. 6. Run the validation gate. Mark each input pass, corrected or unresolved. Do not rank unreliable gaps as operational losses. 7. Investigate one category. Start with the largest reliable dollar variance and choose the evidence path that could confirm or reject the hypothesis. 8. Record the bridge. Separate baseline updates, recording corrections, supported operational usage and unexplained variance. 9. Assign one test. State owner, action, measure, comparison period and review date. Include quality, service and food-safety guardrails where relevant. 10. Close the loop. At the next review, distinguish a real process change from a corrected baseline or timing reversal. Keep the history rather than overwriting the original record.
Once the cause is supported, the RestaurantMargin 30-day food-cost reduction plan provides a broader workflow for selecting and monitoring a corrective action. Use that after diagnosis, rather than treating a generic reduction target as evidence of the cause.
Limitations and tradeoffs
Variance analysis is only as reliable as its period alignment, counts, units, transfers, recipes and yields. An accurate-looking result can still be wrong when an invoice lands outside the cutoff, an open case is estimated inconsistently, a recipe is stale or stock moves between locations without matched records.
Sales mix can also change the theoretical total even when every portion is correct. Yield varies with supplier specification, trimming and preparation. A short period may be distorted by delivery timing or events; a long period can conceal the shift or station where the change began. More frequent counts improve recency but add labour and may introduce counting inconsistency.
Variance does not establish intent or cause. It cannot, by itself, prove waste, theft, poor performance, profit loss or cash savings. Inventory usage, purchasing and cash payments are related but not interchangeable. A corrected transfer or recipe baseline can reduce reported variance without changing physical consumption. Conversely, a well-documented approved comp can explain usage without making it economically free.
Category analysis can locate a control area but may conceal item-level offsets. Item-level analysis is more precise only when sales mapping, recipe versions and unit conversions can support it. For a new menu, irregular event business, major supplier transition or incomplete opening inventory, establish a clean baseline before treating period-to-period movement as an operating trend.
FAQ
What is food cost variance in a restaurant?
It is actual food usage cost minus theoretical food cost for the same period and scope. Theoretical cost comes from recorded sales and current recipe usage; actual usage comes from opening inventory plus purchases minus closing inventory, with transfers and other movements handled consistently.
Should variance be measured in dollars or percentages?
Use both. Dollars show the size of the reconciled gap. Percentage points of food sales help compare periods with different sales. Label the denominator because variance as a percentage of theoretical cost is a different measure.
Is a positive variance always waste?
No. It may reflect price changes, yield, portions, waste, comps, transfers, substitutions, count errors, recipe drift or missing records. Validate the data and inspect evidence before assigning a cause.
How often should a restaurant review variance?
Choose a cadence that supports consistent counts and timely investigation. A weekly rhythm may suit operations with reliable weekly inventory; another operation may need category spot checks or a longer comparable period. Consistency and evidence matter more than adopting a universal schedule.
What should be investigated first?
After validation, start with the largest reliable category variance in dollars. Then select evidence that can test a specific hypothesis. Do not start with the most blame-sensitive explanation or the largest percentage based on uncertain data.
Why can food cost variance improve without cash improving immediately?
The variance measures inventory usage against theoretical usage, while cash depends on when purchases are paid and on other receipts and payments. A recipe-cost update or transfer correction can also change the measured gap without creating cash.
What if part of the variance cannot be explained?
Record the unresolved amount, the checks already completed and the next evidence to inspect. Do not force the bridge to balance by assigning the remainder to waste or theft. An honest unresolved line protects the next decision from false certainty.
Next step
Run your menu numbers before changing prices. Use the free calculator, then turn the best opportunities into a weekly margin routine.
Open the calculator